D3 Generated Chart:
Transfer Times Two Pair
Objective
Determine the technique with the fastest transfer times
Original excel chart for comparison:
Charts reproducing my thesis work using d3
Determine the technique with the fastest transfer times
Details of this study and each technique available from my publication available at ACM’s Digital Library: doi>10.1145/2470654.2470758
Determine the technique with the fastest transfer times
Original excel chart for comparison:
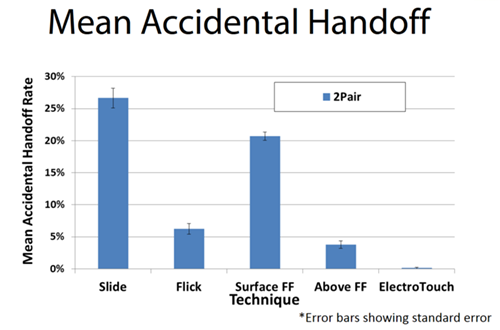
Determine the technique with the most and least number of accidental handoffs
Original excel chart for comparison:
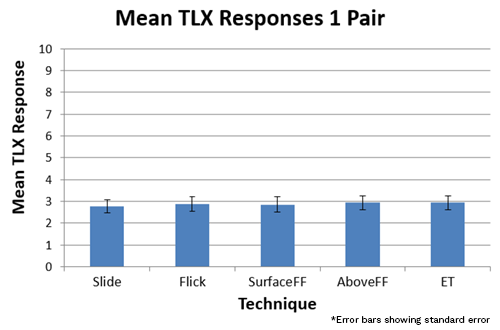
Determine the perceived "effort" of each technique
Original excel chart for comparison:
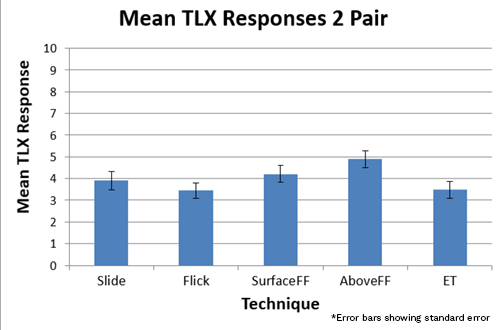
Determine the perceived "effort" of each technique
Original excel chart for comparison:
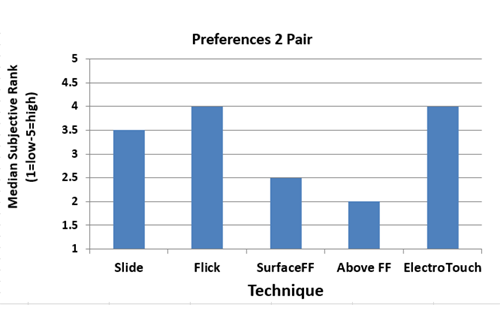
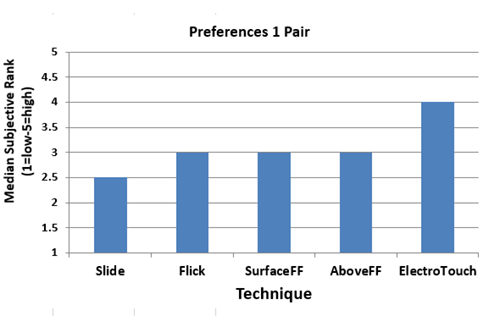
Determine the preference of each technique. The Higher the value the more the technique is preferred
Original excel chart for comparison:
Determine the preference of each technique. The Higher the value the more the technique is preferred
Original excel chart for comparison: